

Visual Work Showcase
Grace Miller: Sparked to Build


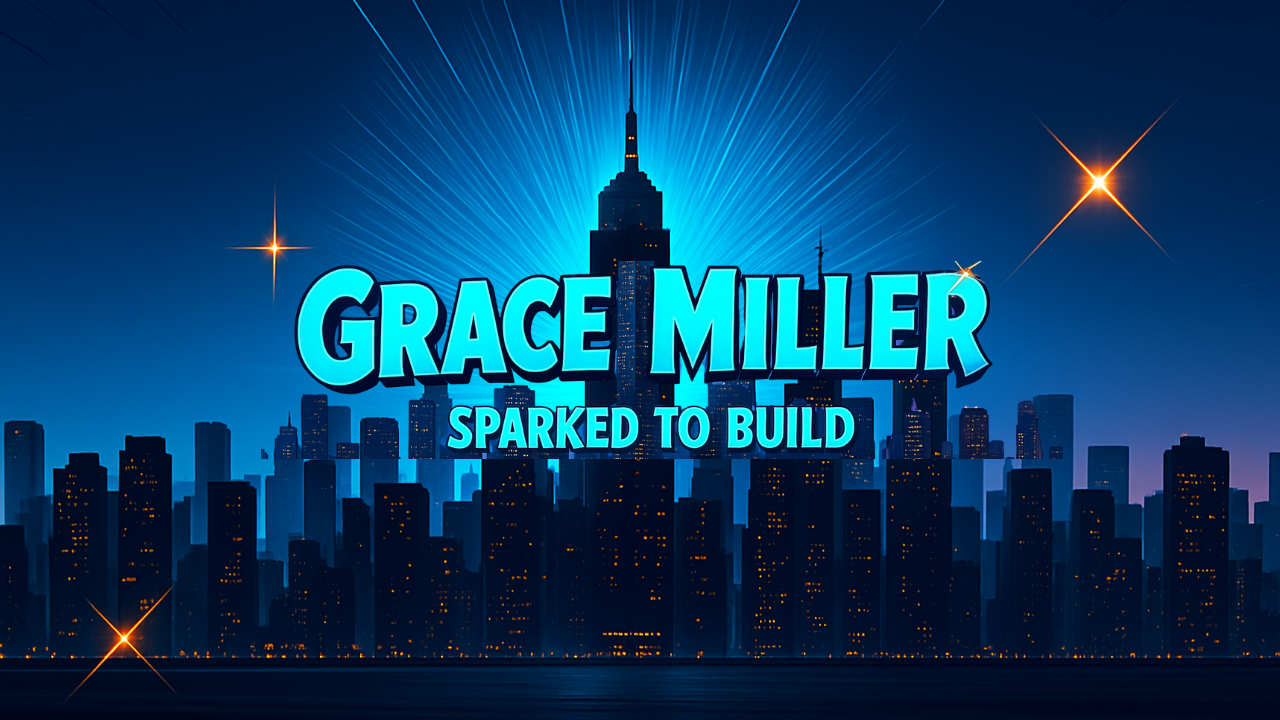
A visual brand system created for my original animated YouTube series “Grace Miller: Sparked to Build.” These assets include channel identity, promotional thumbnails, and banner design reflecting an entrepreneurial journey.
ebbframe: Ambient Loops for Calm & Focus

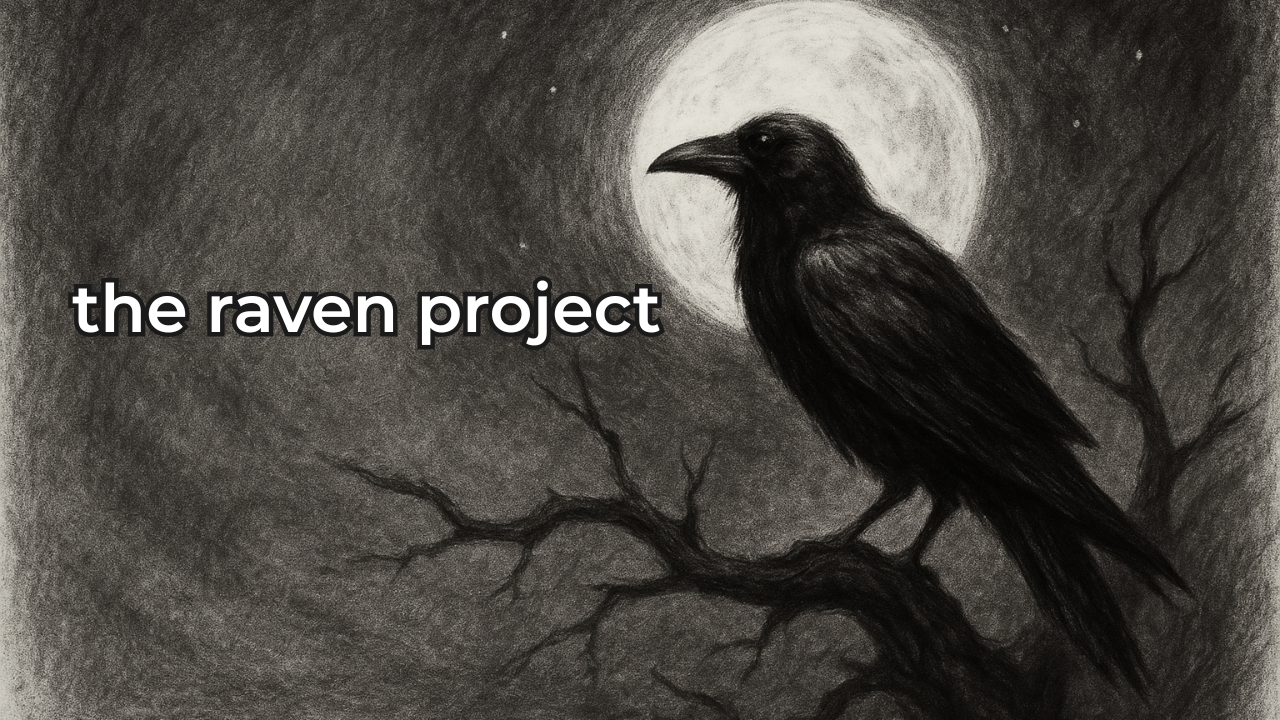
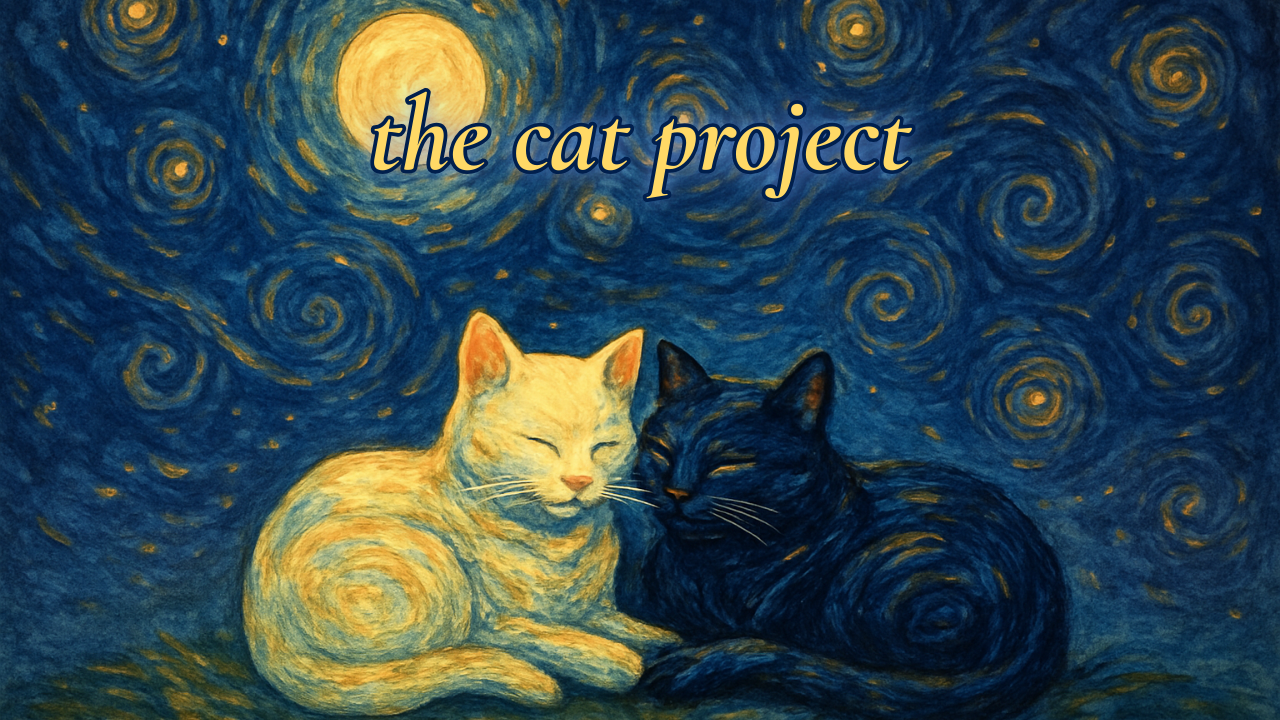
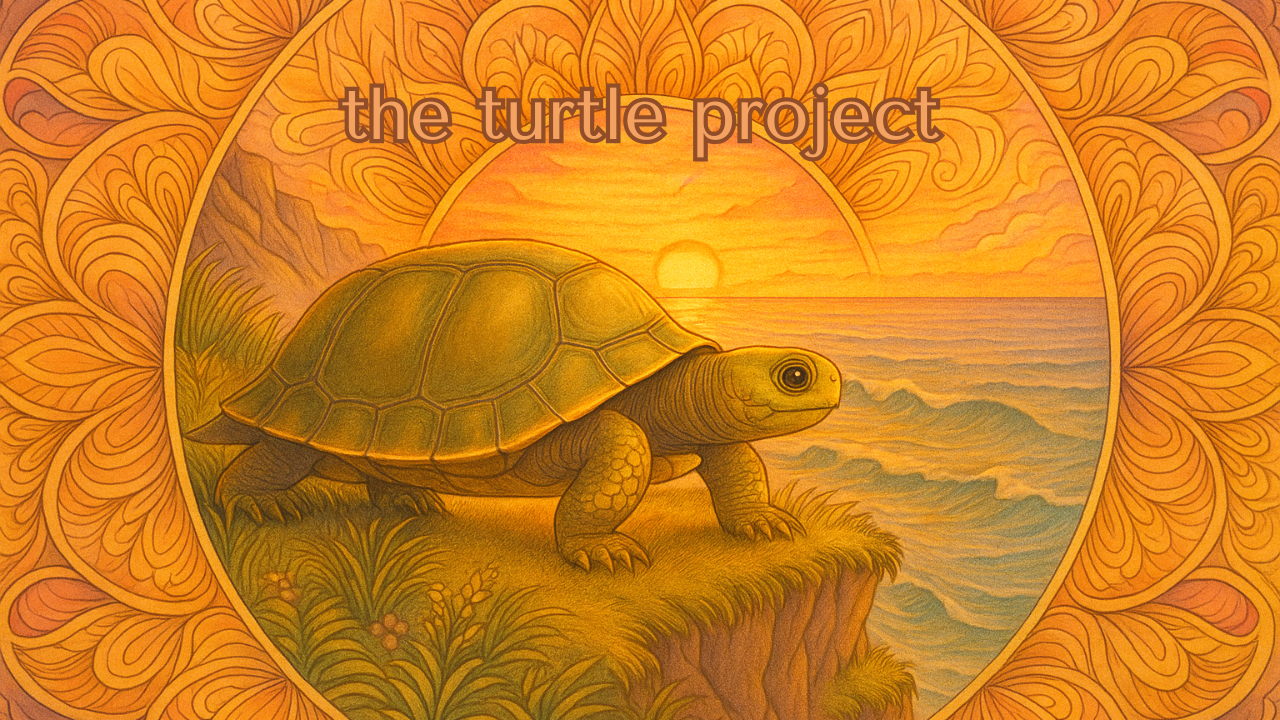

ebbframe is a digital ambient loop channel. The design aesthetic focuses on softness, serenity, and minimalism, reflected in its thumbnails, logo, and clean banner layout.
Interactive Data Visualization Projects
Comcast Financial Analysis Dashboard (2020–2022)
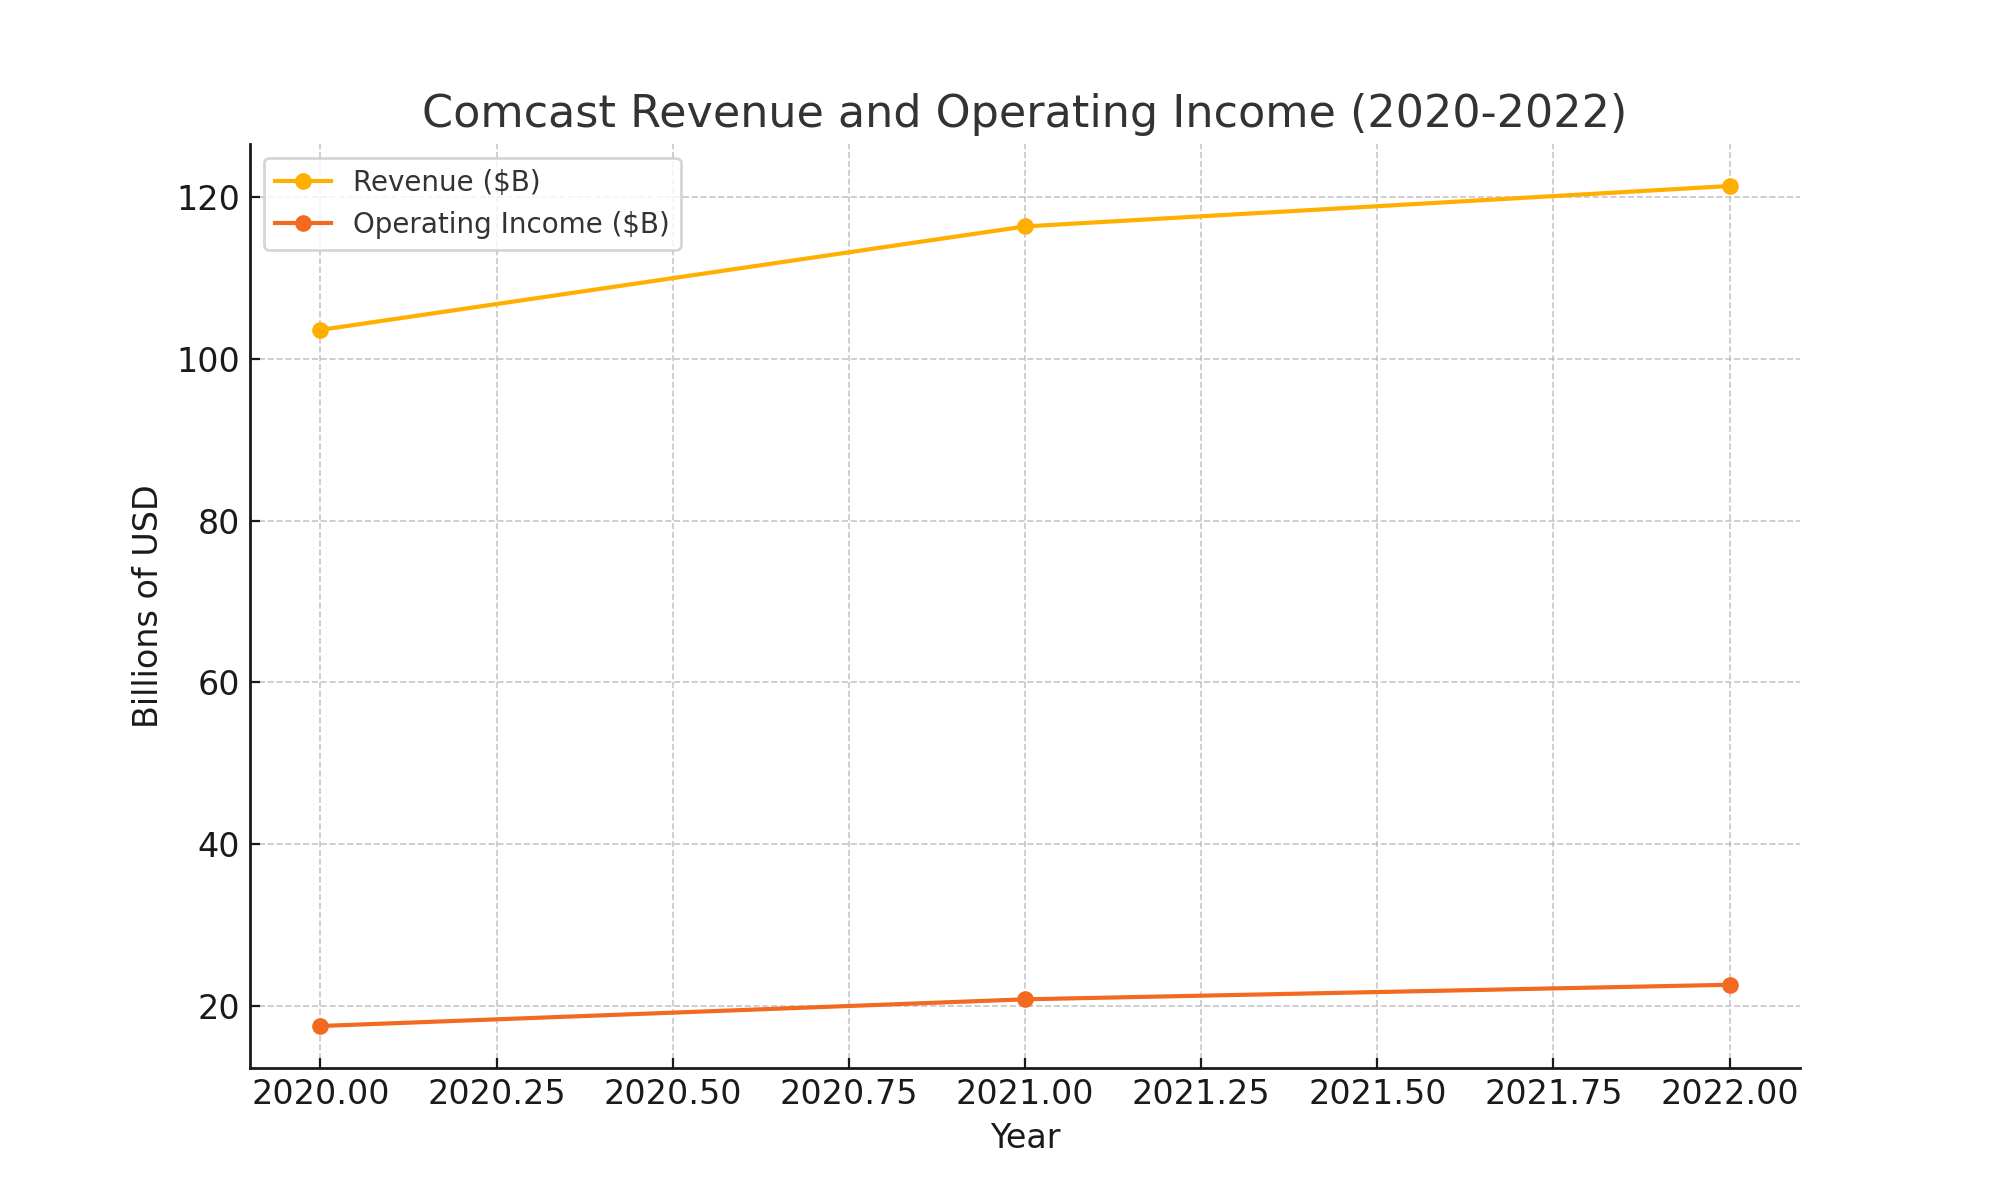

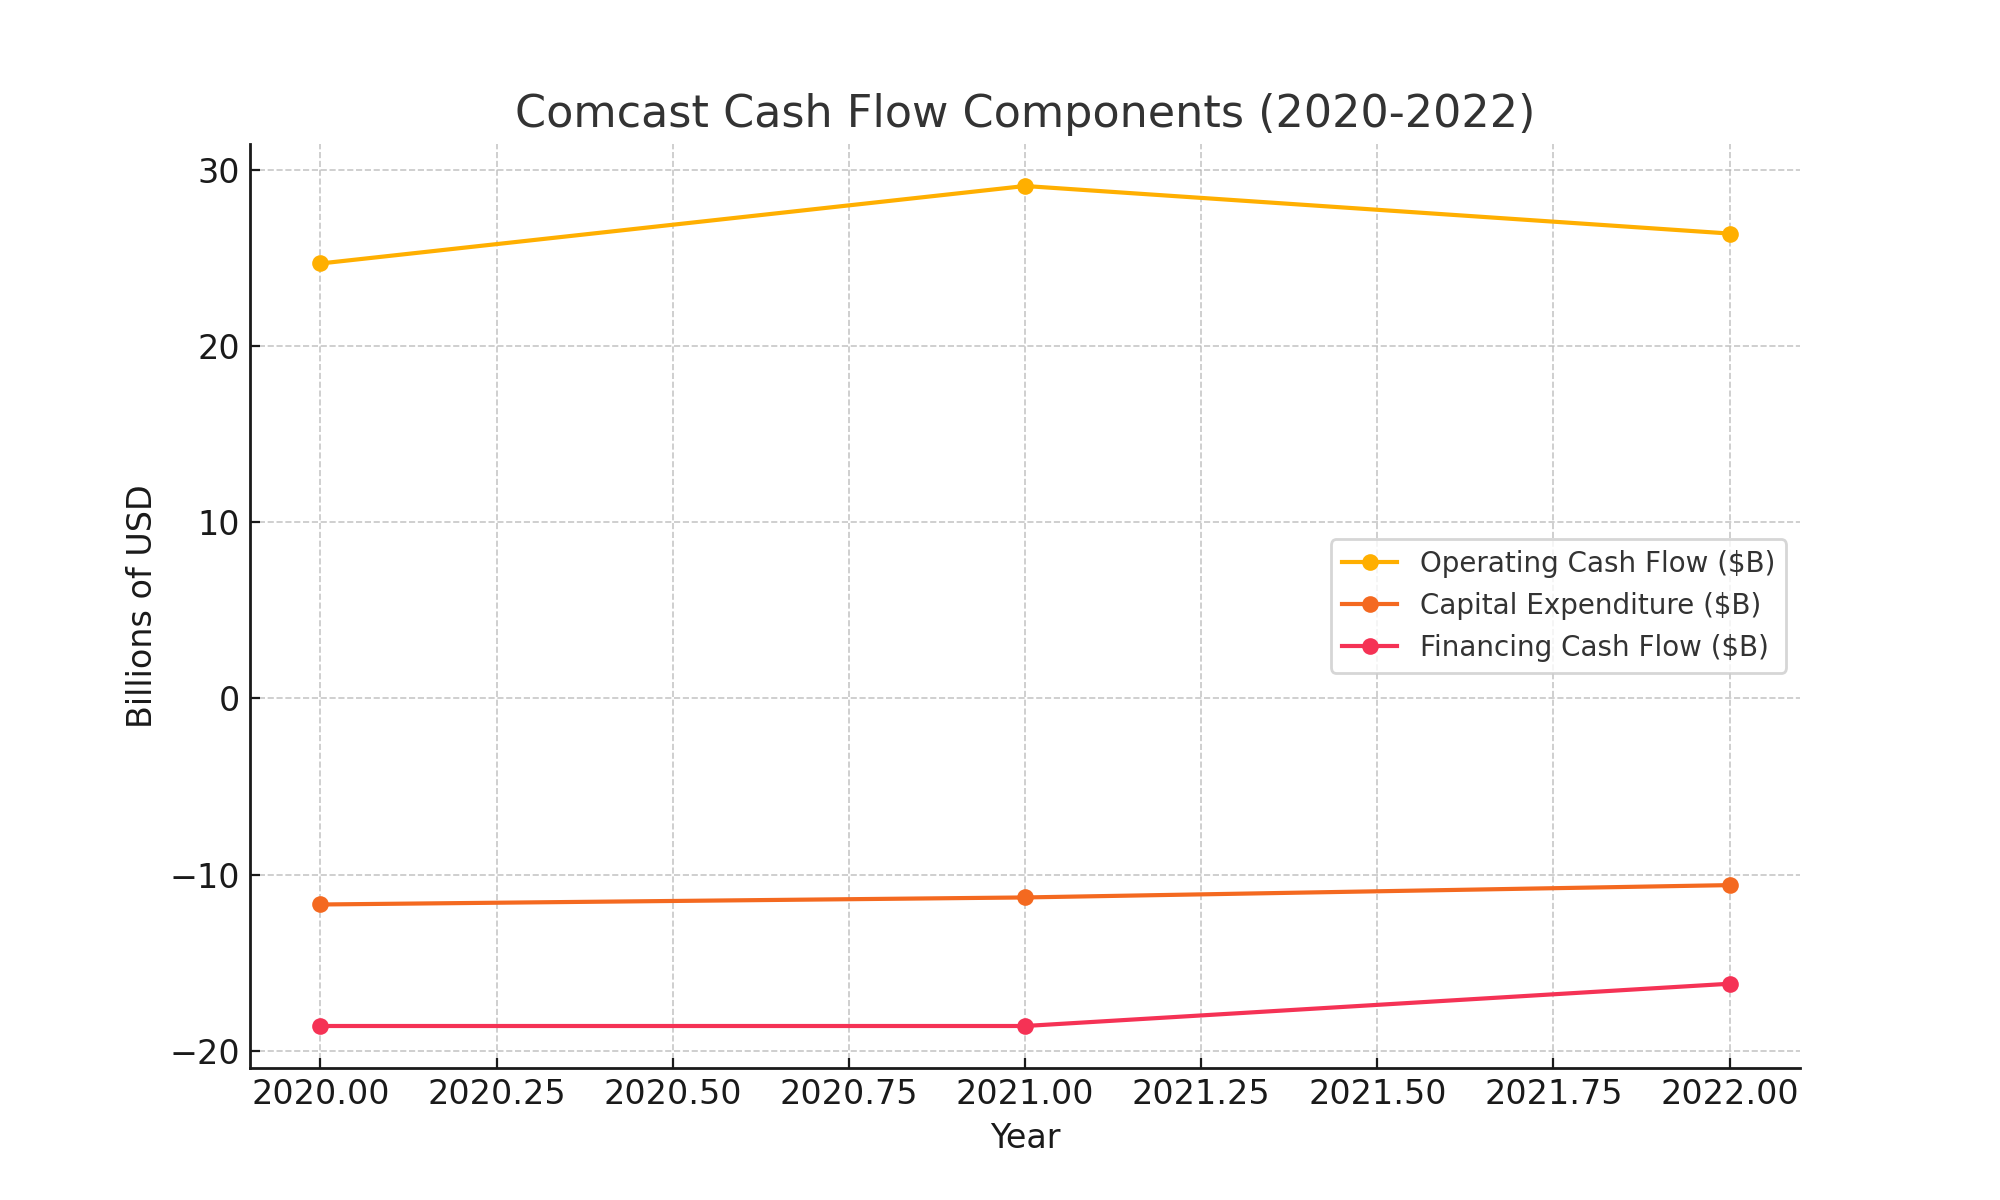
This graduate-level financial analysis project was developed using Excel to explore Comcast Corporation’s 3-year performance across key metrics. The visualizations highlight trends in revenue, operating income, working capital, and cash flow components. The report emphasizes Excel-based charting, financial storytelling, and data presentation techniques used in professional business settings. It showcases a strong understanding of financial KPIs, formatting, and executive-style layout design.
Pokémon Franchise Data Exploration
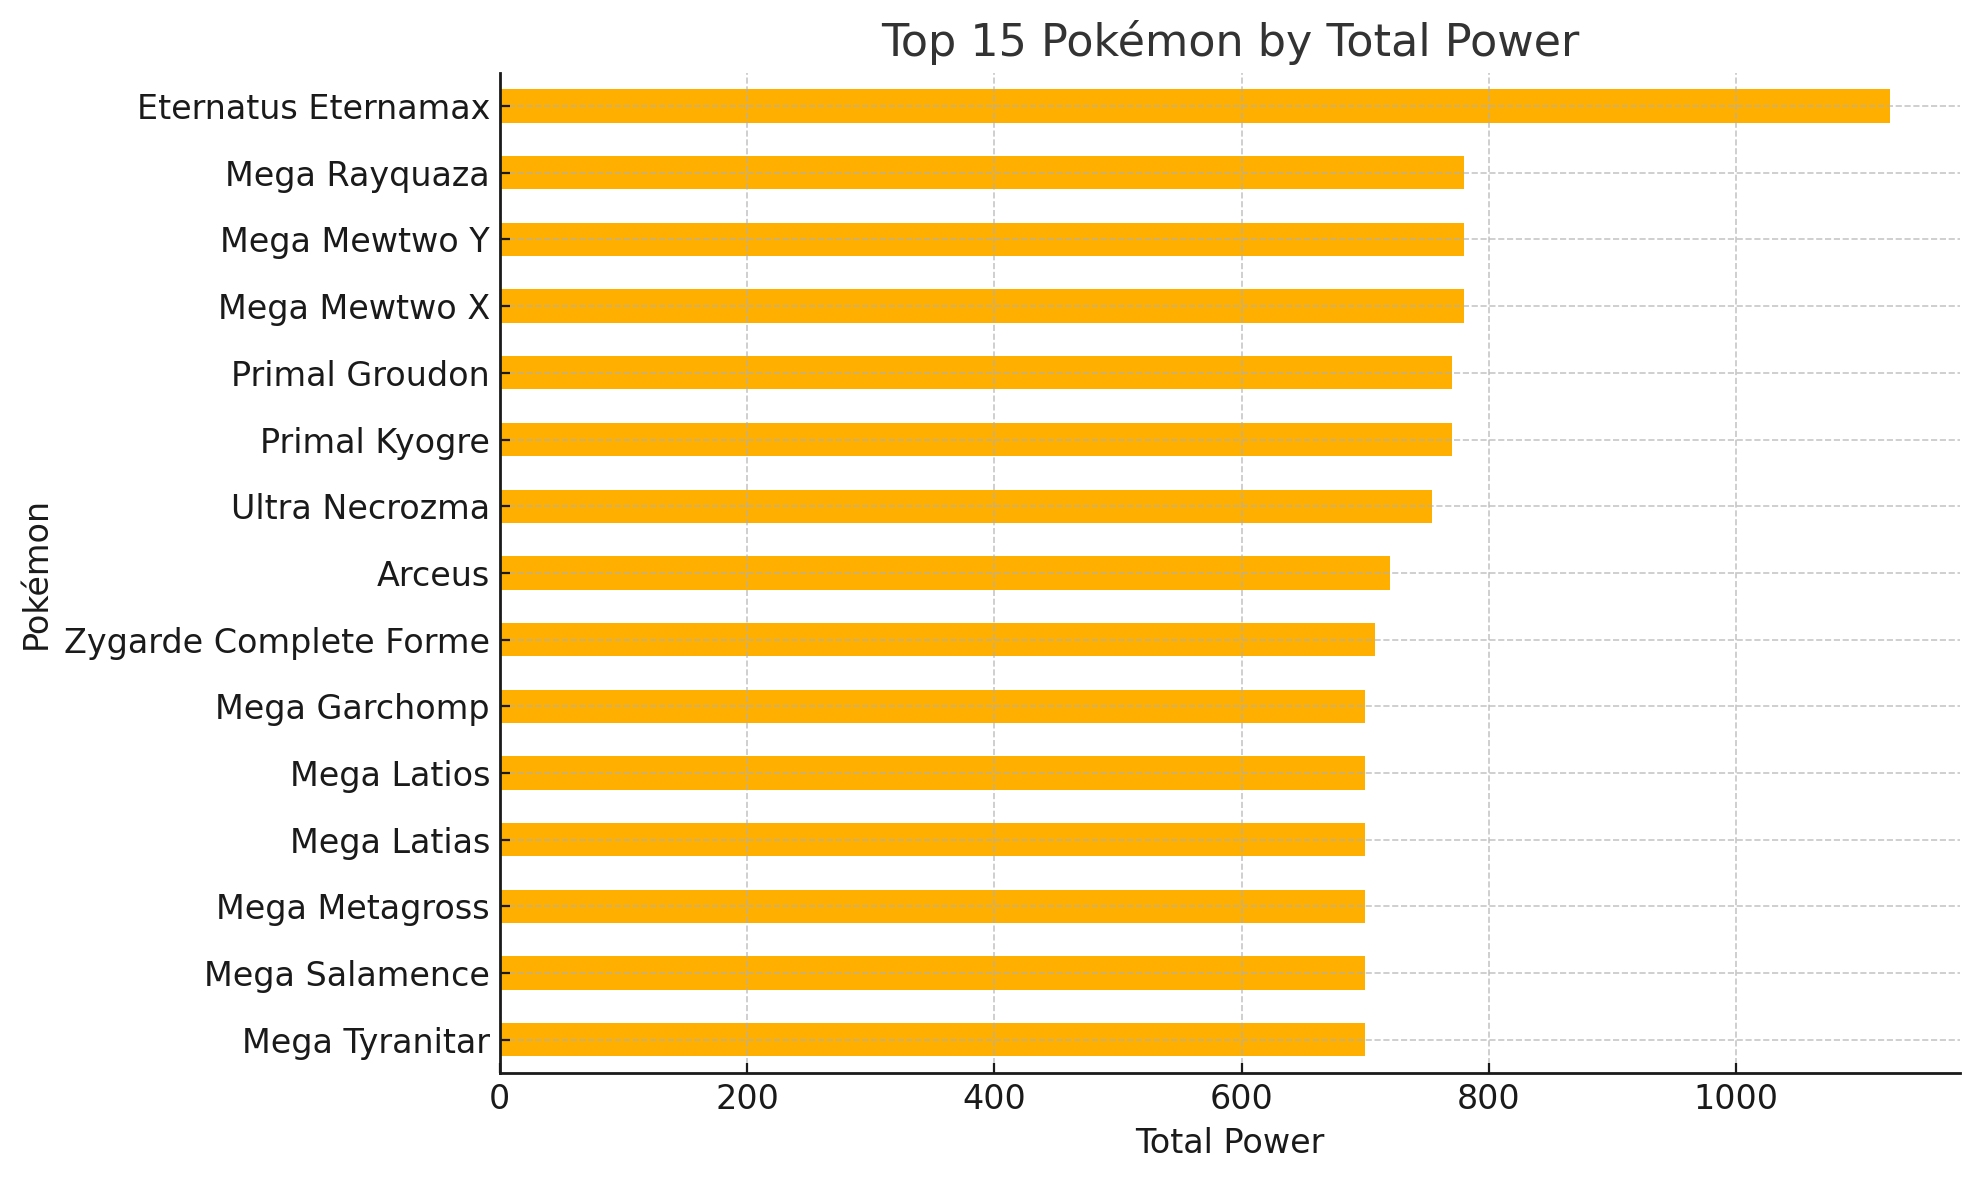
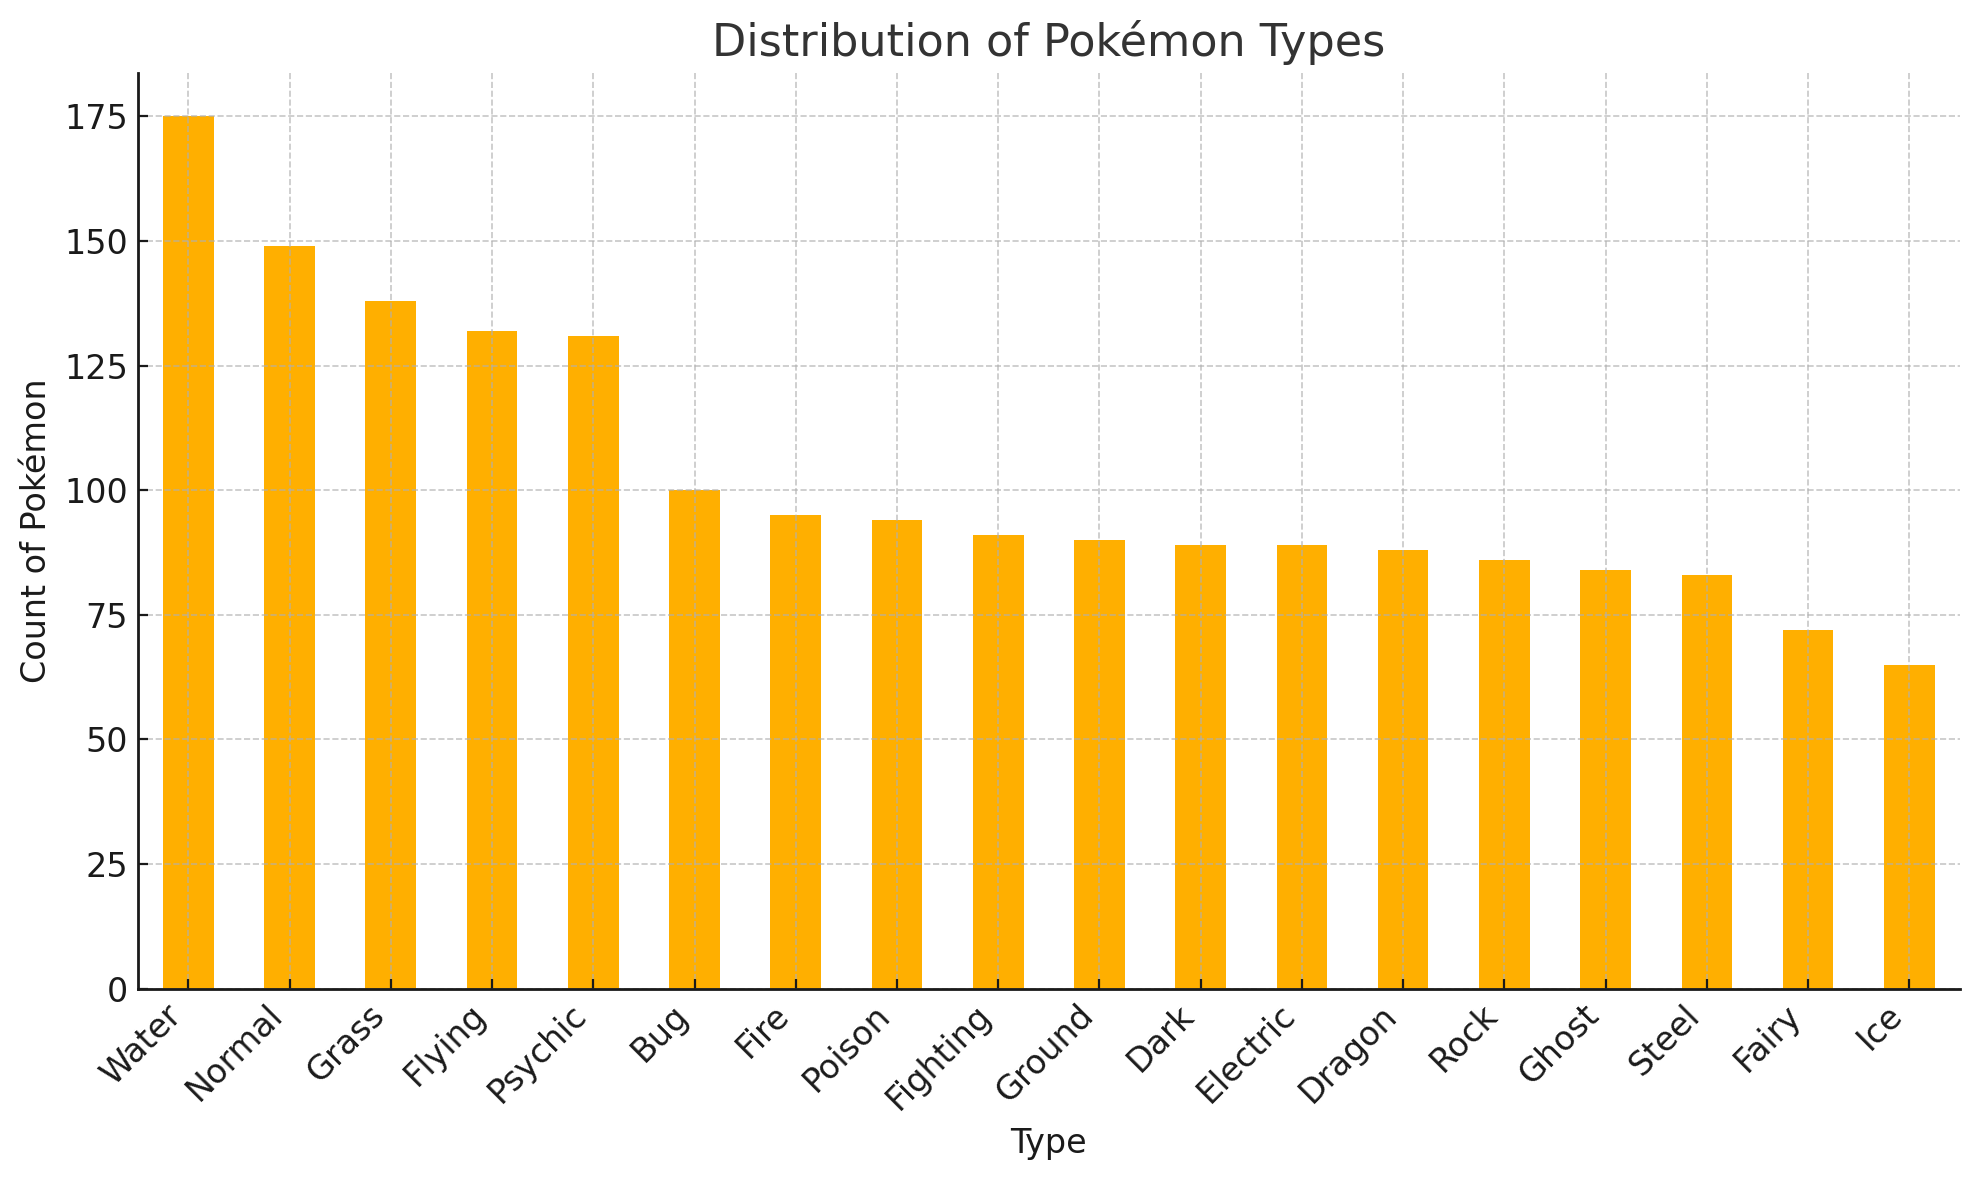

This graduate-level data visualization project explores a comprehensive dataset of Pokémon characters, including power levels, debut appearances, and elemental types. Originally built in Tableau using cleaned Excel data, the report now features static visual representations that demonstrate thoughtful analysis, clear data grouping, and storytelling design. Though no longer interactive, the visualizations still reflect analytical depth and presentation skills aligned with real-world business intelligence work.